This graph shows how well the system performs according to the amount of energy they receive from the sun (in MJ/m^2).
The black line shows the average of Export over Import. Any points above the line means the system performed better than average, any points below the line, mean it performed worse.
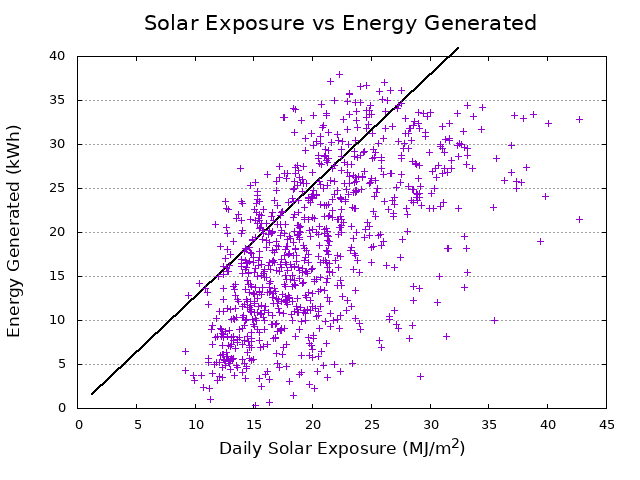
Solar exposure data retrieved from Australian Bureau of Meteorology (ABN 92 637 533 532)
Solar exposure data derived from satellite imagery processed by the Bureau of the Geostationary Meteorological Satellite series operated by Japan Meteorological Agency and from GOES-9 operated by the National Oceanographic & Atmospheric Administration (NOAA) for the Japan Meteorological Agency
//www.bom.gov.au/climate/austmaps/metadata-daily-solar-exposure.shtml
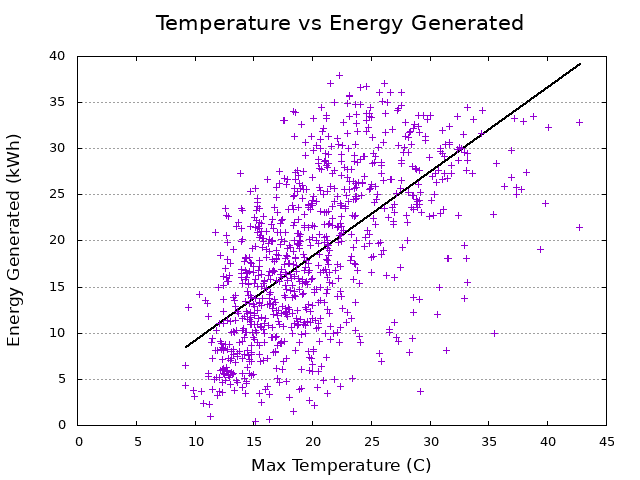
Temperature data retrieved from Australian Bureau of Meteorology (ABN 92 637 533 532)
The black line shows the average of Export over Import. Any points above the line means the system performed better than average, any points below the line, mean it performed worse.
Solar exposure data retrieved from Australian Bureau of Meteorology (ABN 92 637 533 532)
Solar exposure data derived from satellite imagery processed by the Bureau of the Geostationary Meteorological Satellite series operated by Japan Meteorological Agency and from GOES-9 operated by the National Oceanographic & Atmospheric Administration (NOAA) for the Japan Meteorological Agency
//www.bom.gov.au/climate/austmaps/metadata-daily-solar-exposure.shtml
Temperature data retrieved from Australian Bureau of Meteorology (ABN 92 637 533 532)
Current Conditions
- Solar Power 0W
- Solar Today 0kWh
- Total 1503.3 Watt
Pool 11.7W, Main 1304.5W, Tesla 3.4W, AC 70.4W, Sub 112.9W - Last hour usage 0kWh
- Room Temp. 23.7
- Water Level 94%
(1409mm, 10498L) - Last record 2026-06-11 22:41
Solar Information
20/06/2026
- Dawn 06:32
- Sunrise 07:35
- Solar noon 12:21
- Sunset 17:07
- Dusk 18:09